Market Outlook
October 05, 2016
Market Cues
Domestic Indices
Chg (%)
(Pts)
(Close)
Indian markets are likely to open flat tracking global markets and SGX NIFTY.
BSE Sensex
0.3
91
28,335
However, banking stocks could see buying interest, as RBI intends to relax
Nifty
0.4
31
8,769
restructuring norms under S4A.
Mid Cap
0.5
67
13,550
US markets closed on a negative note, after erroneous news that ECB would
Small Cap
0.7
87
13,209
probably wind down its $ 90 bn monthly bond purchases. Despite clarification from
Bankex
0.4
94
22,491
ECB market continued to be under pressure. However, European markets closed
with strong gain backed by recovery in troubled lender Deutsche Bank.
Global Indices
Chg (%)
(Pts)
(Close)
Indian markets closed with a positive note after the RBI’s 25 bps cut in repo rates.
Dow Jones
(0.5)
(85)
18,168
While selective banks moved up, the real winner during the day were the Gas
Nasdaq
(0.2)
(7)
4,859
producers in India i.e ONGC up 4.5%, and GAIL up 4.4%. However, market missed
FTSE
1.3
91
7,074
the fire power which a rate cut should bring. With one of the key events getting over
now, market participants will look forward towards quarterly results.
Nikkei
0.8
137
16,736
Hang Seng
0.4
105
23,689
News Analysis
Shanghai Com
0.2
6
3,005
RBI cuts Repo Rate By 25 bps
Detailed analysis on Pg2
Advances / Declines
BSE
NSE
Investor’s Ready Reckoner
Advances
1,665
932
Key Domestic & Global Indicators
Declines
1,201
666
Unchanged
129
87
Stock Watch: Latest investment recommendations on 150+ stocks
Refer Pg6 onwards
Volumes (` Cr)
Top Picks
CMP
Target
Upside
BSE
4,458
Company
Sector
Rating
(`)
(`)
(%)
NSE
22,143
Amara Raja Batteries Auto & Auto Ancillary Accumulate
1,063
1,174
10.4
HCL Tech
IT
Buy
818
1,000
22.3
Net Inflows (` Cr)
Net
Mtd
Ytd
Bharat Electronics
Capital Goods
Accumulate
1,270
1,414
11.4
Equitas Holdings
Financials
Buy
188
235
25.1
FII
(184)
9,336
50,005
Navkar Corporation Others
Buy
193
265
37.5
MFs
1,127
3,838
13,947
More Top Picks on Pg4
Top Gainers
Price (`)
Chg (%)
Key Upcoming Events
Previous
Consensus
Date
Region
Event Description
Balkrisind
1,094
8.0
Reading
Expectations
Amtekauto
48
7.2
Oct 05 US
Initial Jobless claims
254.00
256.00
Oct 06 Germany
PMI Services
50.60
50.60
Laxmimach
4,442
6.5
Oct 07 UK
Industrial Production (YoY)
2.10
1.30
Ubl
962
6.0
Oct 07 India
Industrial Production YoY
(2.40)
Unionbank
152
5.9
Oct 07 US
Change in Nonfarm payrolls
151.00
174.00
Oct 10 US
Unnemployment rate
4.90
4.90
Top Losers
Price (`)
Chg (%)
Oct 13 India
Imports YoY%
(14.09)
Hathway
30
(2.9)
Oct 13 India
Exports YoY%
(0.30)
Oct 13 China
Exports YoY%
(2.80)
(3.30)
Zeel
564
(2.7)
6.(
More Events on Pg5
Religare
266
(2.5)
Ajantpharm
2,039
(2.4)
Den
73
(2.4)
As on October 04, 2016
Market Outlook
October 05, 2016
News Analysis
RBI cuts Repo Rate By 25 bps
The RBI’s first policy meet after constituting the monetary policy committee (MPC)
has been a constructive one with, all the members of the committee unanimously
agreeing for a 25bps cut in the REPO rate, accordingly the REPO rate has been
reduced by 25 bps and now stands at 6.25%. We believe the rate cut was very
much required for the economy, and if inflation data supports there could be
another cut of 25 bps towards the end of the financial year.
The CPI inflation positively surprised for the month of August when it declined by
102 bps to 5.05% compared to 6.07% in July 2016. This had given a positive
signal for the rate cut during the current policy meet. Rising food prices was the
prime culprit behind the increasing trend in inflation; however a softening price in
food and vegetables on the back of good monsoon led to positive surprise in food
inflation in August.
While the RBI has hinted that there is a marginal upside risk to inflation, we believe
this year crop output could be much better than the previous year, and hence
pressure food inflation is unlikely remerge any time soon. The RBI believes inflation
will be contained at 5% by March, 2017. With G-sec yield softening the cost of
funds of banks should also now come down further; this could lead to better
transmission in rates for banks.
Policy Measures
Policy Repo rate under LAF reduced to 6.25%.
Consequently the reverse Repo rate under LAF adjusted to 5.75% and MSF
rate and Bank Rate to 6.75%.
The RBI expects the uneven recovery in growth in 2015-16 is likely to strengthen
gradually into FY17, backed by normal monsoon, raising agricultural growth and
rural demand the likely boost to urban consumption demand from the
implantation of the 7th Pay Commission Recommendations and OROP. The central
bank has retained its projections for GVA for 2017 at 7.6% and has retained its
inflation target at 5% for FY17.
Outlook
The undertone of the RBI Governor seems more positive towards improving
outlook for the economy, backed by several policy measures taken by the Govt.
While the growth of the economy would also depend on how efficiently GST gets
implemented, certainly we can look forward for improving macro situation in the
quarters to come.
Market Outlook
October 05, 2016
Economic and Political News
SEBI to cut IPO listing time to four days
IMF revises India’s economic growth upwards to 7.6% for FY17 and FY18
Govt gets bids worth `60,969cr on 3rd day of spectrum auction
Maharastra’s sugar output expected to hit 6 year low
Centre, states to review progress of UDAY
Govt extends MIP on select steel products for 2 months.
Corporate News
IOC plans to lay 2,000 Km LPG pipeline
ICICI Bank cuts MCLR rates by 5 bps
Punjab & Sind Bank to raise `500cr via Basel III Bonds
Market Outlook
October 05, 2016
Top Picks ★★★★★
Large Cap
Market Cap
CMP
Target
Upside
Company
Rationale
(` Cr)
(`)
(`)
(%)
To outpace battery industry growth due to better technological
Amara Raja Batteries
18,162
1,063
1,174
10.4
products leading to market share gains in both the
automotive OEM and replacement segments.
Uptick in defense capex by government when coupled with
Bharat Electronics
30,475
1,270
1,414
11.4
BELs strong market positioning, indicate that good times are
ahead for BEL.
The stock is trading at attractive valuations and is factoring all
HCL Tech
1,15,393
818
1,000
22.3
the bad news.
Back on the growth trend, expect a long term growth of 14%
Infosys
2,40,904
1,049
1,370
30.6
to be a US$20bn in FY2020.
Source: Company, Angel Research
Mid Cap
Market Cap
CMP
Target
Upside
Company
Rationale
(` Cr)
(`)
(`)
(%)
Among the top 4 players in the consumer durables segment.
Bajaj Electricals
2,619
259
306
18.1
Improved profitability backed by turn around in E&P
segment. Strong order book lends earnings visibility.
With a focus on the low and medium income (LMI) consumer
Dewan Housing Finance
8,725
299
325
8.7
segment, the company has increased its presence in tier-II &
III cities where the growth opportunity is immense.
Strong loan growth backed by diversified loan portfolio and
adequate CAR. ROE & ROA likely to remain decent as risk of
Equitas Holdings
6,298
188
235
25.1
dilution remains low. Attractive valuations considering
growth.
Economic recovery to have favourable impact on advertising
& circulation revenue growth. Further, the acquisition of a
Jagran Prakashan
6,360
195
225
15.6
radio business (Radio City) would also boost the company's
revenue growth.
Speedier execution and speedier sales, strong revenue
Mahindra Lifespace
1,810
441
522
18.4
visibilty in short-to-long run, attractive valuations
Massive capacity expansion along with rail advantage at ICD
Navkar Corporation
2,748
193
265
37.5
as well CFS augurs well for the company
Market leadership in Hindi news genre and no. 2 viewership
ranking in English news genre, exit from the radio business,
TV Today Network
1,844
309
363
17.4
and anticipated growth in ad spends by corporates to benefit
the stock.
Source: Company, Angel Research
Market Outlook
October 05, 2016
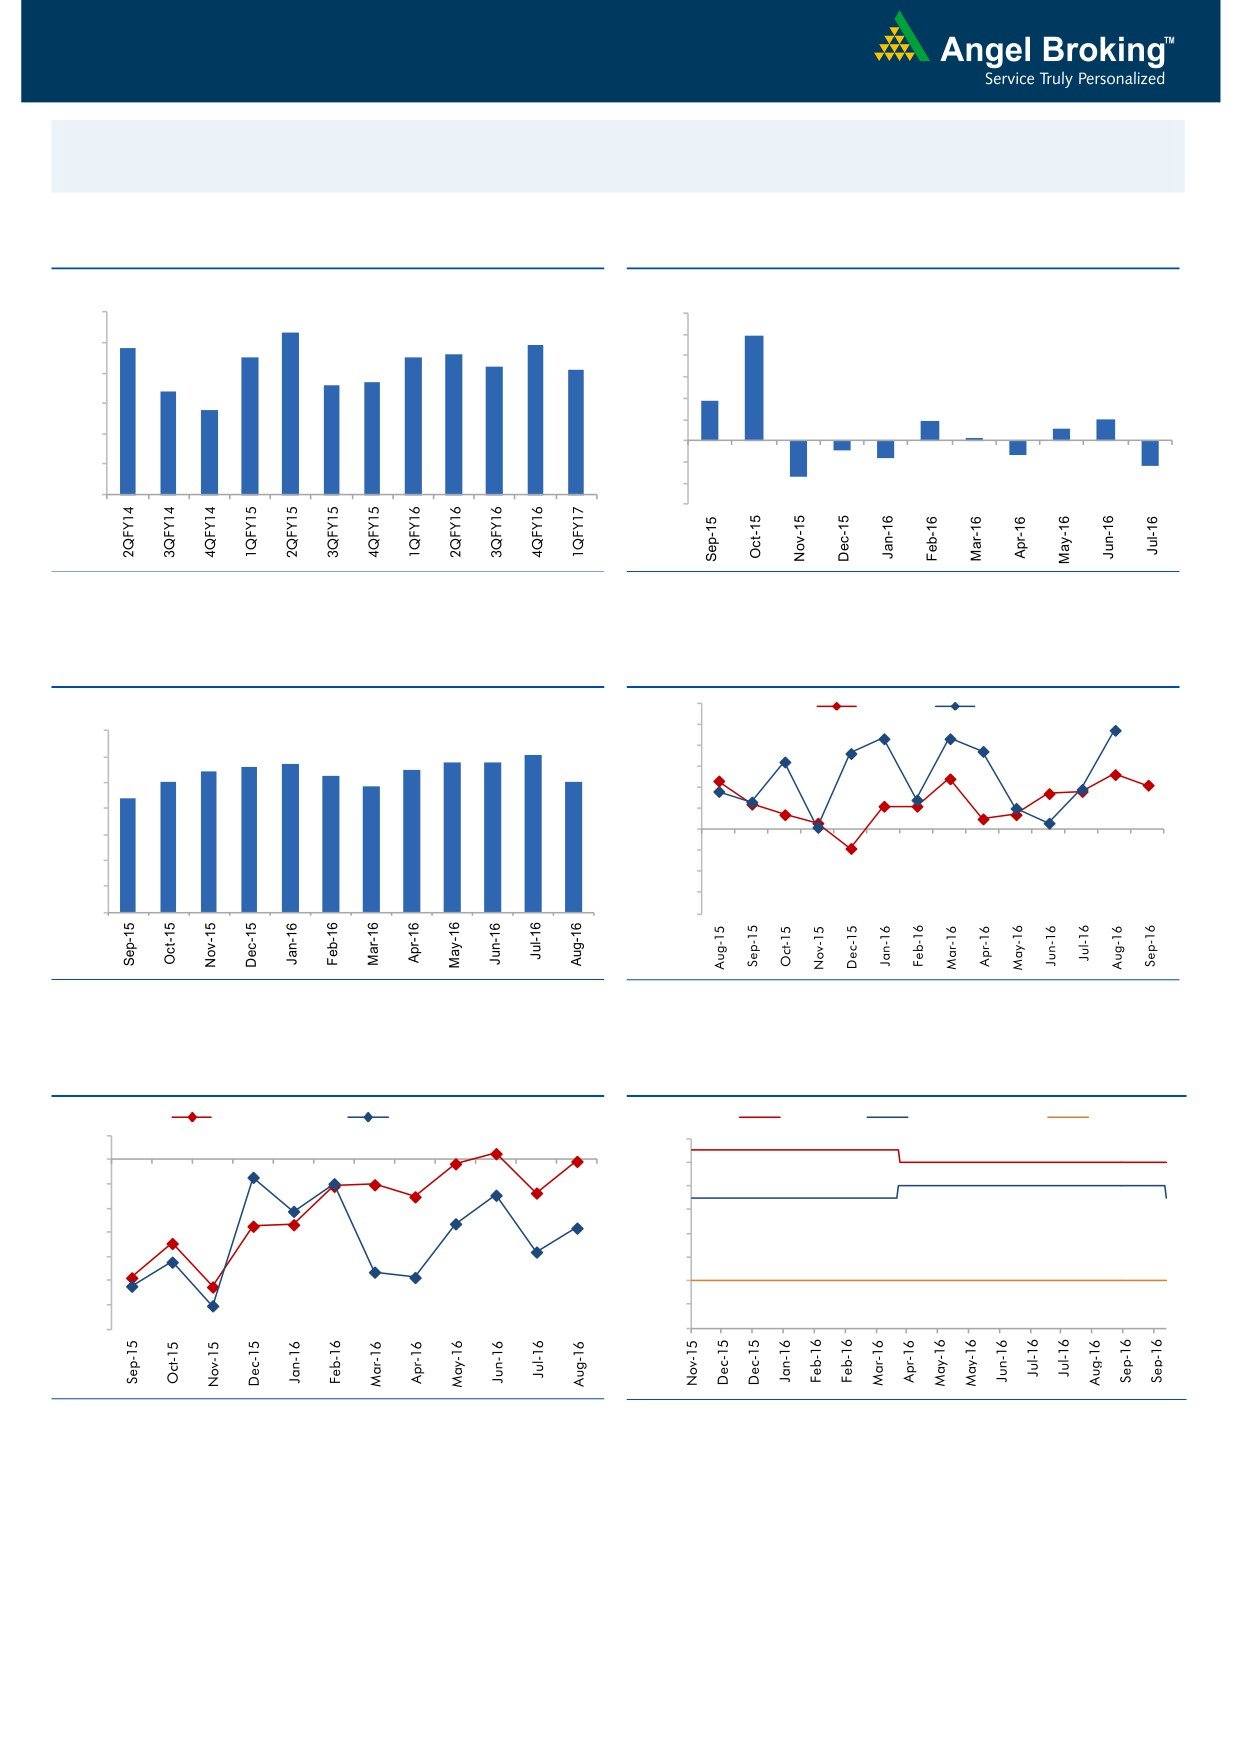
Macro watch
Exhibit 1: Quarterly GDP trends
Exhibit 2: IIP trends
(%)
(%)
9.0
12.0
8.3
9.9
7.8
7.9
8.0
7.5
7.5
7.6
10.0
7.2
7.1
8.0
6.6
6.7
7.0
6.4
6.0
3.7
5.8
6.0
4.0
1.9
2.0
1.1
2.0
0.3
5.0
-
4.0
(2.0)
(0.9)
(1.3)
(1.6)
(4.0)
(2.4)
3.0
(3.4)
(6.0)
Source: CSO, Angel Research
Source: MOSPI, Angel Research
Exhibit 3: Monthly CPI inflation trends
Exhibit 4: Manufacturing and services PMI
56.0
Mfg. PMI
Services PMI
(%)
55.0
7.0
6.1
5.7
5.8
5.8
54.0
6.0
5.4
5.6
5.5
5.0
5.3
5.1
53.0
4.8
5.0
4.4
52.0
4.0
51.0
50.0
3.0
49.0
2.0
48.0
1.0
47.0
-
46.0
Source: MOSPI, Angel Research
Source: Market, Angel Research; Note: Level above 50 indicates expansion
Exhibit 5: Exports and imports growth trends
Exhibit 6: Key policy rates
(%)
Exports yoy growth
Imports yoy growth
(%)
Repo rate
Reverse Repo rate
CRR
5.0
7.00
0.0
6.50
(5.0)
6.00
(10.0)
5.50
(15.0)
5.00
(20.0)
4.50
(25.0)
4.00
(30.0)
3.50
(35.0)
3.00
Source: Bloomberg, Angel Research
Source: RBI, Angel Research
Market Outlook
October 05, 2016
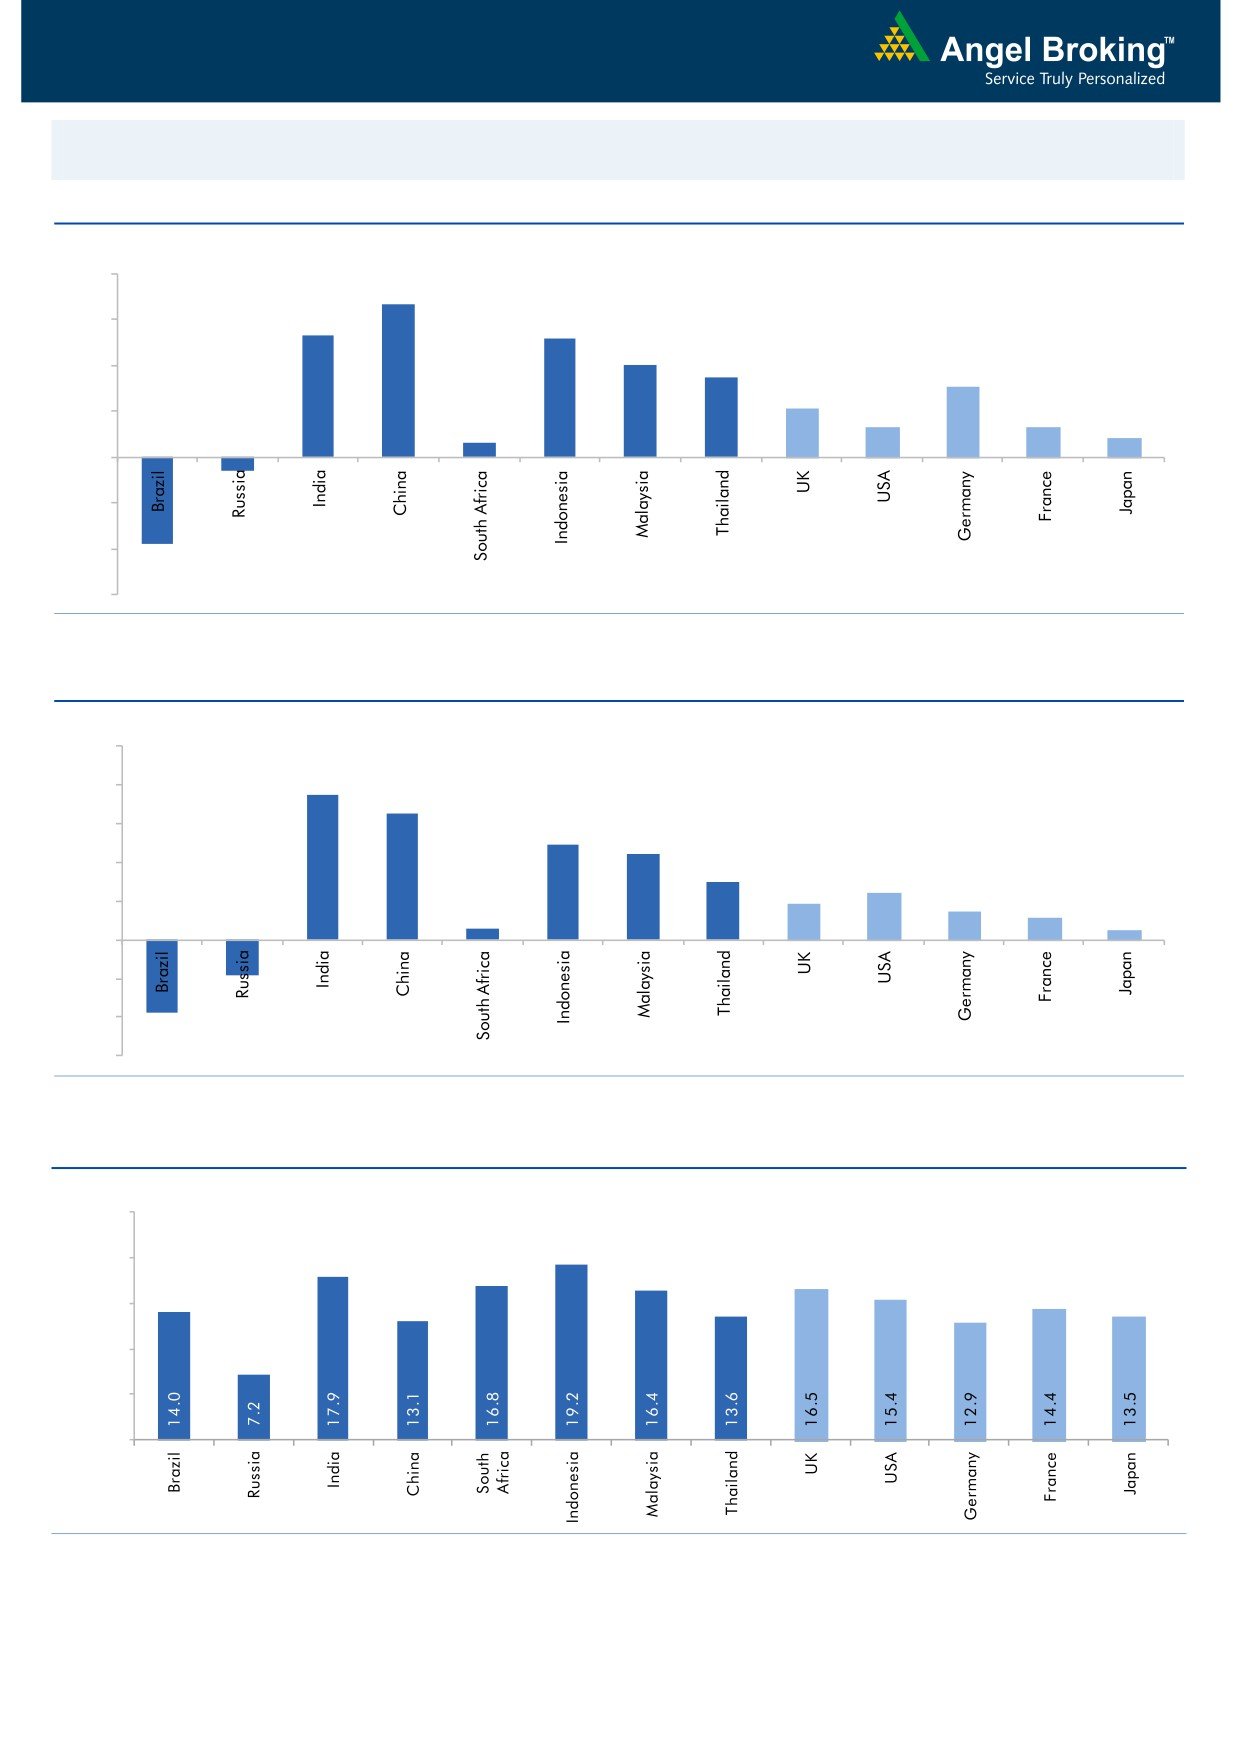
Global watch
Exhibit 1: Latest quarterly GDP Growth (%, yoy) across select developing and developed countries
(%)
8.0
6.7
6.0
5.3
0.6
5.2
4.0
3.5
4.0
3.1
2.1
2.0
1.3
1.3
0.8
-
(2.0)
(0.6)
(4.0)
(3.8)
(6.0)
Source: Bloomberg, Angel Research
Exhibit 2: 2016 GDP Growth projection by IMF (%, yoy) across select developing and developed countries
(%)
10.0
7.5
8.0
6.5
6.0
4.9
4.4
4.0
3.0
2.4
1.9
1.5
2.0
1.1
0.6
0.5
(3.8)
(1.8)
-
(2.0)
(4.0)
(6.0)
Source: IMF, Angel Research
Exhibit 3: One year forward P-E ratio across select developing and developed countries
(x)
25.0
20.0
15.0
10.0
5.0
-
Source: IMF, Angel Research
Market Outlook
October 05, 2016
Exhibit 4: Relative performance of indices across globe
Returns (%)
Country
Name of index
Closing price
1M
3M
1YR
Brazil
Bovespa
59,339
2.7
13.1
35.3
Russia
Micex
1,985
(1.1)
5.4
22.8
India
Nifty
8,769
(0.2)
5.8
11.4
China
Shanghai Composite
3,005
(2.1)
2.6
(5.7)
South Africa
Top 40
45,473
(3.1)
(1.1)
(0.4)
Mexico
Mexbol
47,909
0.1
3.0
9.3
Indonesia
LQ45
947
3.4
15.0
29.7
Malaysia
KLCI
1,661
(1.2)
1.7
3.0
Thailand
SET 50
964
(0.1)
5.9
8.4
USA
Dow Jones
18,168
(0.8)
1.7
8.8
UK
FTSE
7,074
2.6
8.1
11.6
Japan
Nikkei
16,736
(0.9)
7.4
(4.8)
Germany
DAX
10,620
0.4
11.0
6.1
France
CAC
4,503
(0.9)
10.2
(3.1)
Source: Bloomberg, Angel Research
Stock Watch
October 05, 2016
Company Name
Reco
CMP
Target
Mkt Cap
Sales ( Čcr )
OPM(%)
EPS (Č)
PER(x)
P/BV(x)
RoE(%)
EV/Sales(x)
(Č)
Price ( Č)
( Č cr )
FY17E FY18E
FY17E
FY18E
FY17E
FY18E
FY17E
FY18E
FY17E
FY18E
FY17E
FY18E
FY17E
FY18E
Agri / Agri Chemical
Rallis
Neutral
240
-
4,658
1,937
2,164
13.3
14.3
9.0
11.0
26.6
21.8
4.6
4.1
18.4
19.8
2.5
2.2
United Phosphorus
Neutral
676
-
34,283
15,176
17,604
18.5
18.5
37.4
44.6
18.1
15.2
3.5
2.9
21.4
21.2
2.4
2.0
Auto & Auto Ancillary
Ashok Leyland
Buy
81
111
23,151
22,407
26,022
10.6
10.6
5.2
6.4
15.6
12.7
3.5
3.0
23.6
24.7
1.1
0.9
Bajaj Auto
Neutral
2,894
-
83,753
25,093
27,891
19.5
19.2
143.9
162.5
20.1
17.8
5.6
4.9
30.3
29.4
3.1
2.7
Bharat Forge
Neutral
924
-
21,500
7,726
8,713
20.5
21.2
35.3
42.7
26.2
21.6
4.8
4.4
18.9
20.1
2.8
2.5
Eicher Motors
Neutral
25,842
-
70,191
16,583
20,447
17.5
18.0
598.0
745.2
43.2
34.7
14.8
11.2
41.2
38.3
4.1
3.2
Gabriel India
Neutral
121
-
1,733
1,544
1,715
9.0
9.3
5.4
6.3
22.3
19.2
4.2
3.7
18.9
19.5
1.1
1.0
Hero Motocorp
Neutral
3,532
-
70,521
31,253
35,198
15.3
15.0
172.3
192.1
20.5
18.4
7.5
6.4
38.9
37.0
2.1
1.9
Jamna Auto Industries Neutral
218
-
1,740
1,486
1,620
9.8
9.9
15.0
17.2
14.5
12.7
3.2
2.7
21.8
21.3
1.2
1.1
L G Balakrishnan & Bros Neutral
628
-
985
1,302
1,432
11.6
11.9
43.7
53.0
14.4
11.8
2.0
1.8
13.8
14.2
0.8
0.8
Mahindra and Mahindra Neutral
1,415
-
87,906
46,534
53,077
11.6
11.7
67.3
78.1
21.0
18.1
3.4
3.0
15.4
15.8
1.9
1.6
Maruti
Neutral
5,680
-
171,580
69,186
82,217
14.7
14.4
198.5
241.4
28.6
23.5
5.6
4.5
20.2
20.0
2.2
1.8
Minda Industries
Neutral
319
-
2,532
2,728
3,042
9.0
9.1
68.2
86.2
4.7
3.7
1.1
0.8
23.8
24.3
1.0
0.9
Motherson Sumi
Neutral
328
-
46,003
45,896
53,687
7.8
8.3
13.0
16.1
25.1
20.4
8.1
6.5
34.7
35.4
1.1
0.9
Rane Brake Lining
Neutral
1,171
-
927
511
562
11.3
11.5
28.1
30.9
41.7
37.9
6.4
5.8
15.3
15.0
2.0
1.8
Setco Automotive
Neutral
42
-
566
741
837
13.0
13.0
15.2
17.0
2.8
2.5
0.5
0.4
15.8
16.3
1.2
1.0
Tata Motors
Neutral
549
-
158,609
300,209
338,549
8.9
8.4
42.7
54.3
12.9
10.1
2.1
1.7
15.6
17.2
0.6
0.6
TVS Motor
Neutral
377
-
17,932
13,390
15,948
6.9
7.1
12.8
16.5
29.6
22.8
7.4
5.8
26.3
27.2
1.4
1.1
Amara Raja Batteries
Accumulate
1,063
1,174
18,162
5,429
6,471
17.5
17.6
35.3
43.5
30.1
24.4
6.9
5.6
25.3
24.8
3.2
2.6
Exide Industries
Neutral
190
-
16,171
7,439
8,307
15.0
15.0
8.1
9.3
23.5
20.5
3.3
2.9
14.3
16.7
1.8
1.6
Apollo Tyres
Neutral
220
-
11,219
12,877
14,504
14.3
13.9
21.4
23.0
10.3
9.6
1.6
1.4
16.4
15.2
1.0
1.0
Ceat
Neutral
1,370
-
5,543
7,524
8,624
13.0
12.7
131.1
144.3
10.5
9.5
1.9
1.6
19.8
18.6
0.8
0.7
JK Tyres
Neutral
155
-
3,517
7,455
8,056
15.0
15.0
21.8
24.5
7.1
6.3
1.5
1.2
22.8
21.3
0.6
0.5
Swaraj Engines
Neutral
1,333
-
1,656
660
810
15.2
16.4
54.5
72.8
24.5
18.3
7.6
6.9
31.5
39.2
2.3
1.9
Subros
Neutral
131
-
787
1,488
1,681
11.7
11.9
6.4
7.2
20.5
18.3
2.2
2.0
10.8
11.4
0.8
0.7
Indag Rubber
Neutral
202
-
530
286
326
19.8
16.8
11.7
13.3
17.3
15.1
2.9
2.7
17.8
17.1
1.5
1.3
Capital Goods
ACE
Neutral
45
-
442
709
814
4.1
4.6
1.4
2.1
31.9
21.3
1.3
1.2
4.4
6.0
0.8
0.7
BEML
Buy
911
1,157
3,794
3,451
4,055
6.3
9.2
31.4
57.9
29.0
15.7
1.7
1.6
6.3
10.9
1.2
1.0
Bharat Electronics
Accumulate
1,270
1,414
30,475
8,137
9,169
16.8
17.2
58.7
62.5
21.6
20.3
3.4
3.0
44.6
46.3
2.7
2.4
Stock Watch
October 05, 2016
Company Name
Reco
CMP
Target
Mkt Cap
Sales ( Čcr )
OPM(%)
EPS (Č)
PER(x)
P/BV(x)
RoE(%)
EV/Sales(x)
(Č)
Price ( Č)
( Č cr )
FY17E
FY18E
FY17E
FY18E
FY17E
FY18E
FY17E
FY18E
FY17E
FY18E
FY17E
FY18E
FY17E
FY18E
Capital Goods
Voltas
Neutral
396
-
13,116
6,511
7,514
7.9
8.7
12.9
16.3
30.7
24.3
5.5
4.9
16.7
18.5
1.8
1.5
BGR Energy
Neutral
113
-
816
16,567
33,848
6.0
5.6
7.8
5.9
14.5
19.2
0.8
0.8
4.7
4.2
0.2
0.1
BHEL
Neutral
138
-
33,752
28,797
34,742
-
2.8
2.3
6.9
60.0
20.0
1.0
1.0
1.3
4.8
0.8
0.6
Blue Star
Neutral
565
-
5,391
4,351
5,024
6.4
7.1
17.2
20.6
32.9
27.4
21.4
17.9
23.1
24.1
1.3
1.1
Crompton Greaves
Neutral
78
-
4,882
5,777
6,120
5.9
7.0
3.3
4.5
23.6
17.3
1.0
1.0
4.4
5.9
0.8
0.7
Greaves Cotton
Neutral
129
-
3,142
1,755
1,881
16.8
16.9
7.8
8.5
16.5
15.1
3.3
3.1
20.6
20.9
1.5
1.3
Inox Wind
Buy
210
286
4,669
5,605
6,267
15.7
16.4
24.8
30.0
8.5
7.0
2.4
1.7
25.9
24.4
0.9
0.7
KEC International
Neutral
124
-
3,181
9,294
10,186
7.9
8.1
9.9
11.9
12.5
10.4
1.8
1.6
15.6
16.3
0.6
0.5
Thermax
Neutral
885
-
10,545
5,421
5,940
7.3
7.3
25.7
30.2
34.4
29.3
4.2
3.8
12.2
13.1
1.8
1.7
VATech Wabag
Buy
563
681
3,068
3,136
3,845
8.9
9.1
26.0
35.9
21.7
15.7
2.7
2.3
13.4
15.9
0.9
0.7
Cement
ACC
Neutral
1,636
-
30,727
11,225
13,172
13.2
16.9
44.5
75.5
36.8
21.7
3.5
3.2
11.2
14.2
2.7
2.3
Ambuja Cements
Neutral
256
-
50,833
9,350
10,979
18.2
22.5
5.8
9.5
44.1
27.0
3.7
3.3
10.2
12.5
5.4
4.6
India Cements
Neutral
152
-
4,657
4,364
4,997
18.5
19.2
7.9
11.3
19.2
13.4
1.4
1.3
8.0
8.5
1.8
1.6
JK Cement
Neutral
896
-
6,266
4,398
5,173
15.5
17.5
31.2
55.5
28.7
16.2
3.5
3.0
12.0
15.5
2.0
1.6
J K Lakshmi Cement
Neutral
494
-
5,811
2,913
3,412
14.5
19.5
7.5
22.5
65.9
22.0
4.1
3.4
12.5
18.0
2.6
2.2
Orient Cement
Neutral
226
-
4,624
2,114
2,558
18.5
20.5
8.1
11.3
27.9
20.0
4.1
3.5
9.0
14.0
2.8
2.2
UltraTech Cement
Neutral
3,956
-
108,557
25,768
30,385
21.0
23.5
111.0
160.0
35.6
24.7
4.6
4.0
13.5
15.8
4.3
3.6
Construction
ITNL
Neutral
102
-
3,342
8,946
10,017
31.0
31.6
8.1
9.1
12.5
11.2
0.5
0.5
4.2
5.0
3.7
3.4
KNR Constructions
Accumulate
747
802
2,102
1,385
1,673
14.7
14.0
41.2
48.5
18.1
15.4
3.4
2.9
14.9
15.2
1.6
1.3
Larsen & Toubro
Buy
1,449
1,700
135,039
67,665
77,249
10.7
11.5
57.3
71.2
25.3
20.4
2.3
2.2
12.6
14.3
2.2
1.9
Gujarat Pipavav Port
Neutral
179
-
8,656
705
788
52.2
51.7
5.0
5.6
35.8
32.0
3.5
3.2
11.2
11.2
11.9
10.2
Nagarjuna Const.
Neutral
84
-
4,684
8,842
9,775
9.1
8.8
5.3
6.4
15.9
13.2
1.3
1.2
8.2
9.1
0.7
0.6
PNC Infratech
Buy
117
143
3,002
2,350
2,904
13.1
13.2
9.0
8.8
13.0
13.3
0.5
0.4
15.9
13.9
1.4
1.1
Simplex Infra
Neutral
332
-
1,643
6,829
7,954
10.5
10.5
31.4
37.4
10.6
8.9
1.1
1.0
9.9
13.4
0.7
0.6
Power Mech Projects
Neutral
496
-
729
1,801
2,219
12.7
14.6
72.1
113.9
6.9
4.4
1.3
1.1
16.8
11.9
0.4
0.3
Sadbhav Engineering
Accumulate
278
298
4,773
3,598
4,140
10.3
10.6
9.0
11.9
30.9
23.4
3.2
2.8
9.9
11.9
1.6
1.4
NBCC
Neutral
278
-
16,677
7,428
9,549
7.9
8.6
8.2
11.0
33.9
25.3
1.7
1.3
28.2
28.7
2.0
1.5
MEP Infra
Neutral
42
-
688
1,877
1,943
30.6
29.8
3.0
4.2
14.1
10.1
6.8
4.6
0.6
0.6
1.7
1.6
SIPL
Neutral
108
-
3,804
1,036
1,252
65.5
66.2
(8.4)
(5.6)
4.0
4.6
(22.8)
(15.9)
11.9
9.9
Stock Watch
October 05, 2016
Company Name
Reco
CMP
Target
Mkt Cap
Sales ( Čcr )
OPM(%)
EPS (Č)
PER(x)
P/BV(x)
RoE(%)
EV/Sales(x)
(Č)
Price ( Č)
( Č cr )
FY17E
FY18E
FY17E
FY18E
FY17E
FY18E
FY17E
FY18E
FY17E
FY18E
FY17E
FY18E
FY17E
FY18E
Construction
Engineers India
Neutral
254
-
8,543
1,725
1,935
16.0
19.1
11.4
13.9
22.2
18.2
3.1
3.0
13.4
15.3
3.9
3.5
Financials
Axis Bank
Neutral
547
-
130,508
58,081
66,459
3.5
3.5
32.4
44.6
16.9
12.3
2.2
1.9
13.6
16.5
-
-
Bank of Baroda
Neutral
170
-
39,125
19,980
23,178
1.8
1.8
11.5
17.3
14.8
9.8
1.7
1.4
8.3
10.1
-
-
Canara Bank
Neutral
330
-
17,924
15,225
16,836
1.8
1.8
14.5
28.0
22.8
11.8
1.6
1.3
5.8
8.5
-
-
Dewan Housing Finance Accumulate
299
325
8,725
2,225
2,688
2.9
2.9
29.7
34.6
10.1
8.6
1.6
1.4
16.1
16.8
-
-
Equitas Holdings
Buy
188
235
6,298
939
1,281
11.7
11.5
5.8
8.2
32.4
22.9
2.8
2.5
10.9
11.5
-
-
Federal Bank
Neutral
75
-
12,938
9,353
10,623
2.9
2.9
4.4
5.8
17.1
13.0
1.6
1.5
9.5
11.0
-
-
HDFC
Neutral
1,429
-
225,991
11,475
13,450
3.4
3.4
45.3
52.5
31.6
27.2
6.1
5.4
20.2
20.5
-
-
HDFC Bank
Neutral
1,290
-
326,481
46,097
55,433
4.5
4.5
58.4
68.0
22.1
19.0
3.9
3.2
18.8
18.6
-
-
ICICI Bank
Neutral
258
-
150,193
39,029
45,903
3.3
3.3
16.7
16.3
15.5
15.8
1.9
1.7
10.1
12.4
-
-
LIC Housing Finance
Neutral
598
-
30,174
3,712
4,293
2.6
2.5
39.0
46.0
15.3
13.0
2.9
2.5
19.9
20.1
-
-
Punjab Natl.Bank
Neutral
146
-
31,036
23,532
23,595
2.3
2.4
6.8
12.6
21.5
11.6
3.3
2.4
3.3
6.5
-
-
RBL Bank
Accumulate
298
325
11,004
1,783
2,309
2.6
2.6
12.7
16.4
23.4
18.1
2.6
2.3
12.8
13.3
-
-
South Ind.Bank
Neutral
24
-
3,220
6,435
7,578
2.5
2.5
2.7
3.1
8.8
7.7
1.1
1.0
10.1
11.2
-
-
St Bk of India
Neutral
259
-
201,250
88,650
98,335
2.6
2.6
13.5
18.8
19.2
13.8
1.8
1.6
7.0
8.5
-
-
Union Bank
Neutral
152
-
10,439
13,450
14,925
2.3
2.3
25.5
34.5
6.0
4.4
0.9
0.7
7.5
10.2
-
-
Yes Bank
Neutral
1,283
-
54,031
8,978
11,281
3.3
3.4
74.0
90.0
17.3
14.3
3.3
2.8
17.0
17.2
-
-
FMCG
Asian Paints
Neutral
1,192
-
114,365
17,128
18,978
16.8
16.4
19.1
20.7
62.4
57.6
21.7
20.5
34.8
35.5
6.6
6.0
Britannia
Neutral
3,475
-
41,696
9,795
11,040
14.6
14.9
80.3
94.0
43.3
37.0
17.8
13.7
41.2
-
4.1
3.6
Colgate
Neutral
979
-
26,626
4,605
5,149
23.4
23.4
23.8
26.9
41.1
36.4
22.8
17.8
64.8
66.8
5.7
5.1
Dabur India
Neutral
280
-
49,265
8,315
9,405
19.8
20.7
8.1
9.2
34.6
30.4
9.6
8.0
31.6
31.0
5.6
4.9
GlaxoSmith Con*
Neutral
6,186
-
26,014
4,350
4,823
21.2
21.4
179.2
196.5
34.5
31.5
9.2
7.8
27.1
26.8
5.4
4.8
Godrej Consumer
Neutral
1,644
-
55,992
10,235
11,428
18.4
18.6
41.1
44.2
40.0
37.2
8.9
7.5
24.9
24.8
5.6
4.9
HUL
Neutral
860
-
186,114
35,252
38,495
17.6
17.4
20.4
21.9
42.1
39.3
34.6
30.3
82.2
77.3
5.1
4.7
ITC
Buy
241
283
291,450
40,059
44,439
39.0
39.2
9.1
10.1
26.6
23.9
7.2
6.3
27.2
26.5
6.8
6.1
Marico
Neutral
283
-
36,538
6,430
7,349
18.8
19.5
6.4
7.7
44.3
36.8
13.4
11.2
33.2
32.5
5.5
4.8
Nestle*
Neutral
6,650
-
64,117
10,073
11,807
20.7
21.5
124.8
154.2
53.3
43.1
21.9
19.7
34.8
36.7
6.2
5.2
Tata Global
Neutral
142
-
8,949
8,675
9,088
9.8
9.8
7.4
8.2
19.2
17.3
2.2
2.1
7.9
8.1
1.0
0.9
Procter & Gamble
Accumulate
6,905
7,369
22,413
2,939
3,342
23.2
23.0
146.2
163.7
47.2
42.2
105.7
101.4
25.3
23.5
7.2
6.2
Hygiene
Stock Watch
October 05, 2016
Company Name
Reco
CMP
Target
Mkt Cap
Sales ( Čcr )
OPM(%)
EPS (Č)
PER(x)
P/BV(x)
RoE(%)
EV/Sales(x)
(Č)
Price ( Č)
( Č cr )
FY17E FY18E
FY17E
FY18E
FY17E
FY18E
FY17E
FY18E
FY17E
FY18E
FY17E
FY18E
FY17E
FY18E
IT
HCL Tech^
Buy
818
1,000
115,393
49,242
57,168
20.5
20.5
55.7
64.1
14.7
12.8
3.0
2.3
20.3
17.9
2.2
1.8
Infosys
Buy
1,049
1,370
240,904
69,934
79,025
27.5
27.5
64.8
72.0
16.2
14.6
3.6
3.3
22.0
22.3
2.9
2.5
TCS
Buy
2,401
3,004
473,119
121,684
136,286
27.3
27.3
135.0
150.1
17.8
16.0
5.9
5.4
33.2
33.9
3.7
3.2
Tech Mahindra
Buy
429
700
41,599
30,347
33,685
17.0
17.0
37.5
41.3
11.4
10.4
2.5
2.2
21.8
20.7
1.1
0.9
Wipro
Buy
482
680
117,040
51,631
55,822
21.7
17.9
35.9
36.9
13.4
13.1
2.8
2.6
19.0
18.1
2.0
1.7
Media
D B Corp
Neutral
395
-
7,258
2,297
2,590
27.4
28.2
21.0
23.4
18.8
16.9
4.4
3.8
23.7
23.1
3.0
2.6
HT Media
Neutral
85
-
1,982
2,693
2,991
12.6
12.9
7.9
9.0
10.8
9.5
0.9
0.8
7.8
8.3
0.3
0.2
Jagran Prakashan
Buy
195
225
6,360
2,355
2,635
28.0
28.0
10.8
12.5
18.0
15.6
3.9
3.4
21.7
21.7
2.7
2.4
Sun TV Network
Neutral
524
-
20,640
2,850
3,265
70.1
71.0
26.2
30.4
20.0
17.2
5.1
4.5
24.3
25.6
6.8
5.8
Hindustan Media
Neutral
290
-
2,129
1,016
1,138
24.3
25.2
27.3
30.1
10.6
9.6
2.0
1.8
16.2
15.8
1.4
1.2
Ventures
TV Today Network
Buy
309
363
1,844
637
743
27.5
27.5
18.4
21.4
16.8
14.5
2.9
2.5
17.4
17.2
2.5
2.0
Metals & Mining
Coal India
Neutral
321
-
202,818
84,638
94,297
21.4
22.3
24.5
27.1
13.1
11.9
5.5
5.2
42.6
46.0
1.9
1.7
Hind. Zinc
Neutral
252
-
106,309
14,252
18,465
55.9
48.3
15.8
21.5
15.9
11.7
2.6
2.3
17.0
20.7
7.5
5.8
Hindalco
Neutral
155
-
31,914
107,899
112,095
7.4
8.2
9.2
13.0
16.8
11.9
0.8
0.8
4.8
6.6
0.8
0.8
JSW Steel
Neutral
1,785
-
43,135
53,201
58,779
16.1
16.2
130.6
153.7
13.7
11.6
1.8
1.6
14.0
14.4
1.6
1.4
NMDC
Neutral
111
-
43,909
6,643
7,284
44.4
47.7
7.1
7.7
15.6
14.4
1.4
1.3
8.8
9.2
4.4
3.9
SAIL
Neutral
49
-
20,155
47,528
53,738
(0.7)
2.1
(1.9)
2.6
18.8
0.5
0.5
(1.6)
3.9
1.3
1.2
Vedanta
Neutral
187
-
55,440
71,744
81,944
19.2
21.7
13.4
20.1
14.0
9.3
1.2
1.1
8.4
11.3
1.2
0.9
Tata Steel
Neutral
390
-
37,887
121,374
121,856
7.2
8.4
18.6
34.3
21.0
11.4
1.3
1.2
6.1
10.1
1.0
0.9
Oil & Gas
Cairn India
Neutral
217
-
40,760
9,127
10,632
4.3
20.6
8.8
11.7
24.7
18.6
0.8
0.8
3.3
4.2
5.9
4.9
GAIL
Neutral
402
-
51,024
56,220
65,198
9.3
10.1
27.1
33.3
14.8
12.1
1.4
1.3
9.3
10.7
1.1
0.9
ONGC
Neutral
274
-
234,207
137,222
152,563
15.0
21.8
19.5
24.1
14.0
11.4
1.2
1.1
8.5
10.1
2.0
1.8
Indian Oil Corp
Neutral
613
-
148,749
373,359
428,656
5.9
5.5
54.0
59.3
11.4
10.3
1.8
1.6
16.0
15.6
0.6
0.5
Reliance Industries
Neutral
1,095
-
355,113
301,963
358,039
12.1
12.6
87.7
101.7
12.5
10.8
1.3
1.2
10.7
11.3
1.7
1.4
Pharmaceuticals
Alembic Pharma
Neutral
660
-
12,445
3,483
4,083
20.2
21.4
24.3
30.4
27.2
21.7
6.2
4.9
25.5
25.3
3.5
2.9
Aurobindo Pharma
Neutral
867
-
50,734
15,720
18,078
23.7
23.7
41.4
47.3
20.9
18.3
5.4
4.3
29.6
26.1
3.5
3.0
Aventis*
Neutral
4,100
-
9,443
2,357
2,692
17.3
17.3
153.5
169.2
26.7
24.2
4.5
3.7
25.8
28.4
3.7
3.0
Cadila Healthcare
Neutral
389
-
39,772
11,126
13,148
22.0
22.0
17.1
20.0
22.7
19.4
5.8
4.6
28.8
26.6
3.6
2.9
Cipla
Sell
595
490
47,840
15,378
18,089
17.4
18.4
21.6
27.2
27.6
21.9
3.6
3.1
13.7
15.2
3.3
2.8
Stock Watch
October 05, 2016
Company Name
Reco
CMP
Target
Mkt Cap
Sales ( Čcr )
OPM(%)
EPS (Č)
PER(x)
P/BV(x)
RoE(%)
EV/Sales(x)
(Č)
Price ( Č)
( Č cr )
FY17E FY18E
FY17E
FY18E
FY17E
FY18E
FY17E
FY18E
FY17E
FY18E
FY17E
FY18E
FY17E
FY18E
Pharmaceuticals
Dr Reddy's
Neutral
3,152
-
52,231
16,043
18,119
23.1
24.7
126.0
157.8
25.0
20.0
3.7
3.2
15.7
17.1
3.2
2.8
Dishman Pharma
Sell
251
45
4,050
1,718
1,890
22.7
22.8
9.5
11.3
26.4
22.2
2.6
2.3
10.1
10.9
2.8
2.5
GSK Pharma*
Neutral
2,872
-
24,328
3,528
3,811
16.6
18.8
51.8
59.4
55.5
48.4
14.8
14.8
26.3
30.6
6.7
6.2
Indoco Remedies
Sell
318
225
2,929
1,112
1,289
18.2
18.2
13.2
15.6
24.1
20.4
4.3
3.6
19.2
19.2
2.7
2.4
Ipca labs
Neutral
620
-
7,826
3,303
3,799
15.3
15.3
17.3
19.7
35.9
31.5
3.1
2.9
9.1
9.4
2.5
2.2
Lupin
Buy
1,490
1,809
67,164
15,912
18,644
26.4
26.7
58.1
69.3
25.6
21.5
5.0
4.1
21.4
20.9
4.3
3.5
Sun Pharma
Buy
764
944
183,944
31,129
35,258
30.0
30.9
28.0
32.8
27.3
23.3
4.2
3.5
18.7
18.9
5.5
4.7
Power
Tata Power
Neutral
77
-
20,947
36,916
39,557
17.4
27.1
5.1
6.3
15.2
12.3
1.3
1.2
9.0
10.3
1.6
1.4
NTPC
Neutral
152
-
125,166
86,605
95,545
17.5
20.8
11.8
13.4
12.9
11.3
1.3
1.2
10.5
11.1
2.8
2.8
Power Grid
Neutral
181
-
94,535
25,763
29,762
74.3
73.1
14.8
17.3
12.2
10.5
1.9
1.7
16.9
17.5
7.9
7.5
Real Estate
Prestige Estate
Neutral
201
-
7,541
4,707
5,105
25.2
26.0
10.3
13.0
19.5
15.5
1.6
1.5
10.3
10.2
2.8
2.5
MLIFE
Buy
441
522
1,810
1,152
1,300
22.7
24.6
29.9
35.8
14.8
12.3
1.1
1.0
7.6
8.6
2.3
1.9
Telecom
Bharti Airtel
Neutral
323
-
129,296
105,086
114,808
34.5
34.7
12.2
16.4
26.5
19.7
1.8
1.7
6.8
8.4
2.1
1.9
Idea Cellular
Neutral
81
-
29,221
40,133
43,731
37.2
37.1
6.4
6.5
12.7
12.5
1.1
1.0
8.2
7.6
1.7
1.5
zOthers
Abbott India
Neutral
4,789
-
10,177
3,153
3,583
14.1
14.4
152.2
182.7
31.5
26.2
154.5
131.9
25.6
26.1
2.9
2.5
Bajaj Electricals
Buy
259
306
2,619
5,099
5,805
5.6
5.9
11.4
14.6
22.8
17.8
3.0
2.7
13.4
15.1
0.5
0.5
Finolex Cables
Neutral
446
-
6,827
2,883
3,115
12.0
12.1
14.2
18.6
31.4
24.0
16.7
14.6
15.8
14.6
2.1
1.9
Goodyear India*
Neutral
726
-
1,675
1,598
1,704
10.4
10.2
49.4
52.6
14.7
13.8
67.9
59.5
18.2
17.0
0.7
102.0
Hitachi
Neutral
1,650
-
4,487
2,081
2,433
8.8
8.9
33.4
39.9
49.4
41.4
39.9
33.2
22.1
21.4
2.1
1.8
Jyothy Laboratories
Neutral
361
-
6,559
1,440
2,052
11.5
13.0
8.5
10.0
42.5
36.1
10.3
9.5
18.6
19.3
4.8
3.4
Page Industries
Neutral
15,541
-
17,334
2,450
3,124
20.1
17.6
299.0
310.0
52.0
50.1
346.1
264.2
47.1
87.5
7.1
5.6
Relaxo Footwears
Neutral
466
-
5,599
2,085
2,469
9.2
8.2
7.6
8.0
61.7
58.7
23.9
20.4
17.9
18.8
2.8
2.4
Siyaram Silk Mills
Neutral
1,418
-
1,330
1,799
2,040
11.6
11.7
104.9
122.4
13.5
11.6
2.2
1.9
16.4
16.4
0.9
0.8
Styrolution ABS India*
Neutral
594
-
1,045
1,440
1,537
9.2
9.0
40.6
42.6
14.6
13.9
37.4
34.0
12.3
11.6
0.7
0.6
TVS Srichakra
Neutral
3,866
-
2,960
2,304
2,614
13.7
13.8
231.1
266.6
16.7
14.5
434.4
342.0
33.9
29.3
1.3
1.1
HSIL
Neutral
350
-
2,527
2,384
2,515
15.8
16.3
15.3
19.4
22.9
18.0
22.7
19.5
7.8
9.3
1.2
1.1
Kirloskar Engines India
Neutral
357
-
5,163
2,554
2,800
9.9
10.0
10.5
12.1
34.0
29.5
14.2
13.4
10.7
11.7
1.7
1.5
Ltd
M M Forgings
Neutral
425
-
513
546
608
20.4
20.7
41.3
48.7
10.3
8.7
58.2
51.5
16.6
17.0
0.8
0.7
Banco Products (India)
Neutral
215
-
1,534
1,353
1,471
12.3
12.4
14.5
16.3
14.8
13.2
20.4
18.4
14.5
14.6
1.1
115.3
Stock Watch
October 05, 2016
Company Name
Reco
CMP
Target
Mkt Cap
Sales ( Čcr )
OPM(%)
EPS (Č)
PER(x)
P/BV(x)
RoE(%)
EV/Sales(x)
(Č)
Price ( Č)
( Č cr )
FY17E
FY18E
FY17E
FY18E
FY17E
FY18E
FY17E
FY18E
FY17E
FY18E
FY17E
FY18E
FY17E
FY18E
zOthers
Competent Automobiles Neutral
197
-
121
1,137
1,256
3.1
2.7
28.0
23.6
7.0
8.3
37.9
34.2
14.3
11.5
0.1
0.1
Nilkamal
Neutral
1,348
-
2,012
1,995
2,165
10.7
10.4
69.8
80.6
19.3
16.7
77.1
66.9
16.6
16.5
1.0
0.9
Visaka Industries
Neutral
197
-
313
1,051
1,138
10.3
10.4
21.0
23.1
9.4
8.5
25.3
23.7
9.0
9.2
0.6
0.5
Transport Corporation of
Neutral
186
-
1,424
2,671
2,911
8.5
8.8
13.9
15.7
13.4
11.9
1.8
1.6
13.7
13.8
0.6
0.6
India
Elecon Engineering
Accumulate
59
63
645
1,482
1,660
13.7
14.5
3.9
5.8
15.2
10.2
3.6
3.3
7.8
10.9
0.8
0.7
Surya Roshni
Neutral
229
-
1,002
3,342
3,625
7.8
7.5
17.3
19.8
13.2
11.6
25.1
20.2
10.5
10.8
0.6
0.5
MT Educare
Neutral
150
-
596
366
417
17.7
18.2
9.4
10.8
16.0
13.9
3.5
3.1
22.2
22.3
1.5
1.3
Radico Khaitan
Neutral
127
-
1,686
1,659
1,802
13.0
13.2
6.3
7.4
20.0
17.2
1.7
1.6
8.6
9.3
1.5
1.3
Garware Wall Ropes
Neutral
543
-
1,188
873
938
12.9
13.1
30.9
34.9
17.6
15.6
2.8
2.4
15.7
15.2
1.3
1.2
Wonderla Holidays
Neutral
394
-
2,223
287
355
38.0
40.0
11.3
14.2
34.8
27.7
5.0
4.4
21.4
23.9
7.4
6.0
Linc Pen & Plastics
Neutral
270
-
399
382
420
9.3
9.5
13.5
15.7
20.1
17.2
3.4
3.0
17.1
17.3
1.1
1.0
The Byke Hospitality
Neutral
194
-
779
287
384
20.5
20.5
7.6
10.7
25.6
18.2
5.3
4.3
20.7
23.5
2.7
2.0
Interglobe Aviation
Neutral
951
-
34,263
21,122
26,005
14.5
27.6
110.7
132.1
8.6
7.2
51.4
36.7
168.5
201.1
1.6
1.3
Coffee Day Enterprises
Neutral
227
-
4,670
2,964
3,260
20.5
21.2
4.7
8.0
-
28.3
2.6
2.4
5.5
8.5
2.0
1.8
Ltd
Navneet Education
Neutral
102
-
2,425
1,062
1,147
24.0
24.0
6.1
6.6
16.7
15.4
3.4
3.0
20.6
19.8
2.4
2.2
Navkar Corporation
Buy
193
265
2,748
408
612
42.9
42.3
6.8
11.5
28.5
16.8
2.0
1.8
6.9
10.5
7.6
5.1
UFO Moviez
Neutral
469
-
1,294
619
685
33.2
33.4
30.0
34.9
15.6
13.4
2.2
1.9
13.8
13.9
1.8
1.4
VRL Logistics
Neutral
310
-
2,827
1,902
2,119
16.7
16.6
14.6
16.8
21.3
18.4
4.7
4.1
21.9
22.2
1.6
1.4
Team Lease Serv.
Neutral
1,070
-
1,829
3,229
4,001
1.5
1.8
22.8
32.8
47.0
32.6
5.0
4.4
10.7
13.4
0.5
0.4
S H Kelkar & Co.
Neutral
311
-
4,499
1,036
1,160
15.1
15.0
6.1
7.2
51.0
43.3
5.4
5.0
10.7
11.5
4.2
3.7
Quick Heal
Neutral
231
-
1,621
408
495
27.3
27.0
7.7
8.8
29.9
26.3
2.8
2.8
9.3
10.6
3.1
2.6
Narayana Hrudaya
Neutral
338
-
6,902
1,873
2,166
11.5
11.7
2.6
4.0
127.7
85.2
7.8
7.1
6.1
8.3
3.8
3.3
Manpasand Bever.
Neutral
772
-
3,864
836
1,087
19.6
19.4
16.9
23.8
45.7
32.4
5.5
4.8
12.0
14.8
4.4
3.3
Parag Milk Foods
Neutral
309
-
2,596
1,919
2,231
9.3
9.6
9.5
12.9
32.7
23.9
5.1
4.2
15.5
17.5
1.5
1.3
Mirza International
Buy
96
113
1,151
1,024
1,148
18.0
18.0
6.9
8.0
13.9
12.0
2.3
2.0
16.6
16.2
1.3
1.2
Source: Company, Angel Research; Note: *December year end; #September year end; &October year end; Price as on October 04, 2016
Market Outlook
October 05, 2016
Research Team Tel: 022 - 39357800
DISCLAIMER
Angel Broking Private Limited (hereinafter referred to as “Angel”) is a registered Member of National Stock Exchange of India
Limited,Bombay Stock Exchange Limited and Metropolitan Stock Exchange Limited. It is also registered as a Depository Participant with
CDSL and Portfolio Manager with SEBI. It also has registration with AMFI as a Mutual Fund Distributor. Angel Broking Private Limited is a
registered entity with SEBI for Research Analyst in terms of SEBI (Research Analyst) Regulations, 2014 vide registration number
INH000000164. Angel or its associates has not been debarred/ suspended by SEBI or any other regulatory authority for accessing
/dealing in securities Market. Angel or its associates/analyst has not received any compensation / managed or
co-managed public offering of securities of the company covered by Analyst during the past twelve months.
This document is solely for the personal information of the recipient, and must not be singularly used as the basis of any investment
decision. Nothing in this document should be construed as investment or financial advice. Each recipient of this document should make
such investigations as they deem necessary to arrive at an independent evaluation of an investment in the securities of the companies
referred to in this document (including the merits and risks involved), and should consult their own advisors to determine the merits and
risks of such an investment.
Reports based on technical and derivative analysis center on studying charts of a stock's price movement, outstanding positions and
trading volume, as opposed to focusing on a company's fundamentals and, as such, may not match with a report on a company's
fundamentals. Investors are advised to refer the Fundamental and Technical Research Reports available on our website to evaluate the
contrary view, if any.
The information in this document has been printed on the basis of publicly available information, internal data and other reliable
sources believed to be true, but we do not represent that it is accurate or complete and it should not be relied on as such, as this
document is for general guidance only. Angel Broking Pvt. Limited or any of its affiliates/ group companies shall not be in any way
responsible for any loss or damage that may arise to any person from any inadvertent error in the information contained in this report.
Angel Broking Pvt. Limited has not independently verified all the information contained within this document. Accordingly, we cannot
testify, nor make any representation or warranty, express or implied, to the accuracy, contents or data contained within this document.
While Angel Broking Pvt. Limited endeavors to update on a reasonable basis the information discussed in this material, there may be
regulatory, compliance, or other reasons that prevent us from doing so.
This document is being supplied to you solely for your information, and its contents, information or data may not be reproduced,
redistributed or passed on, directly or indirectly.
Neither Angel Broking Pvt. Limited, nor its directors, employees or affiliates shall be liable for any loss or damage that may arise from
or in connection with the use of this information.